


ON STAGE, BACKSTAGE UND …
Das Wichtigste in aller Kürze


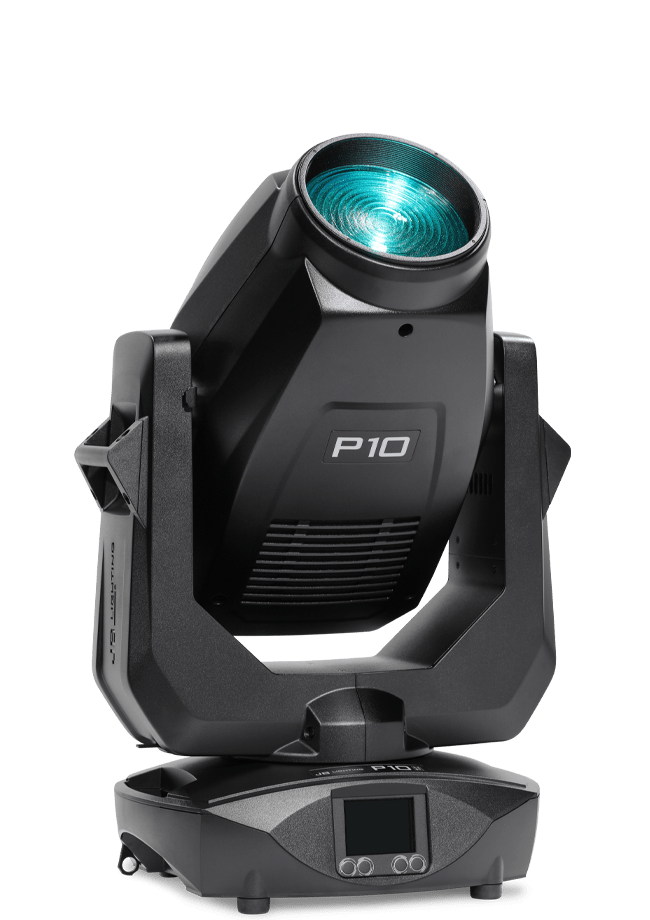
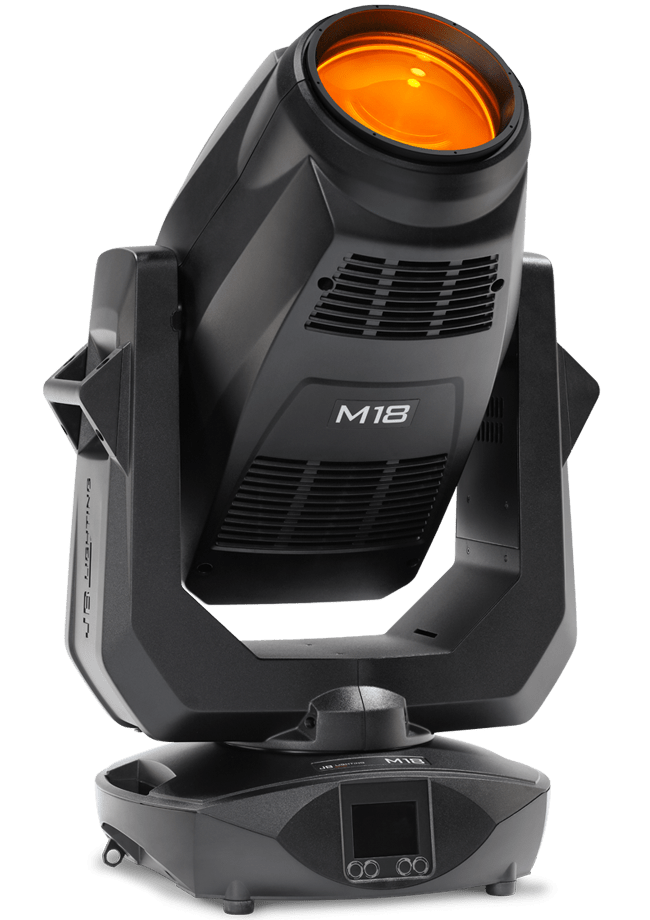
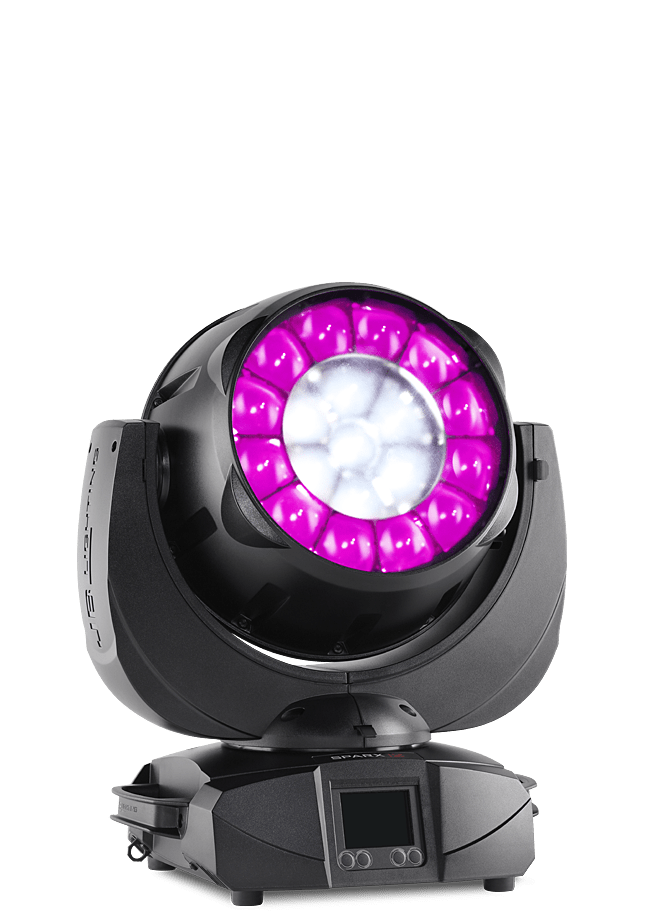
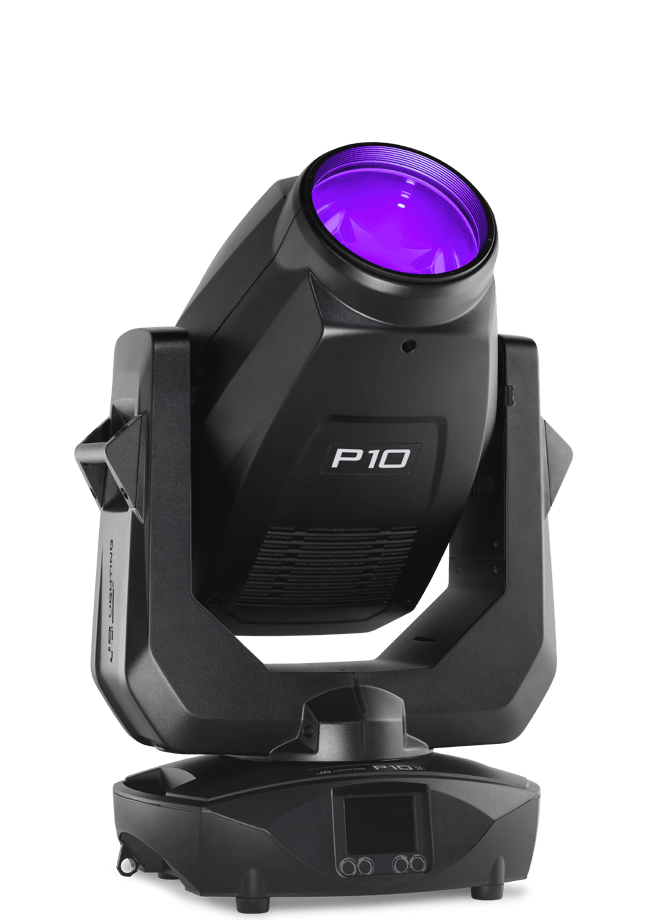
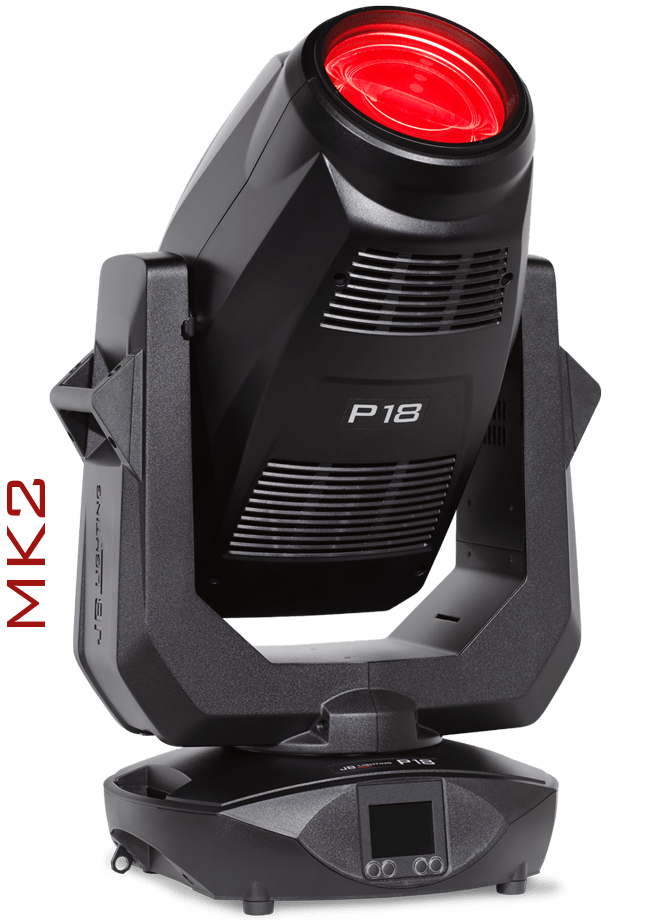
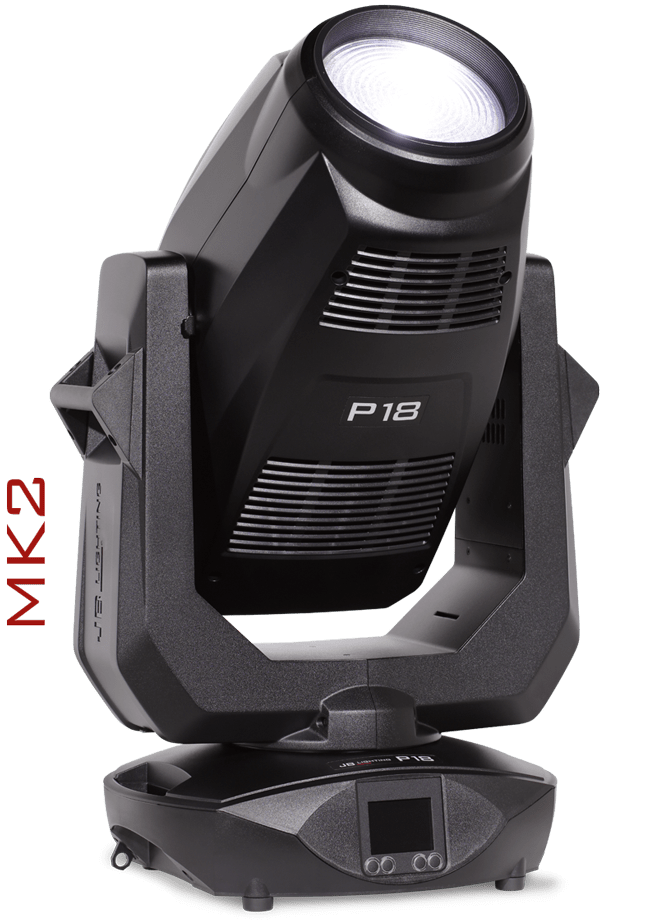
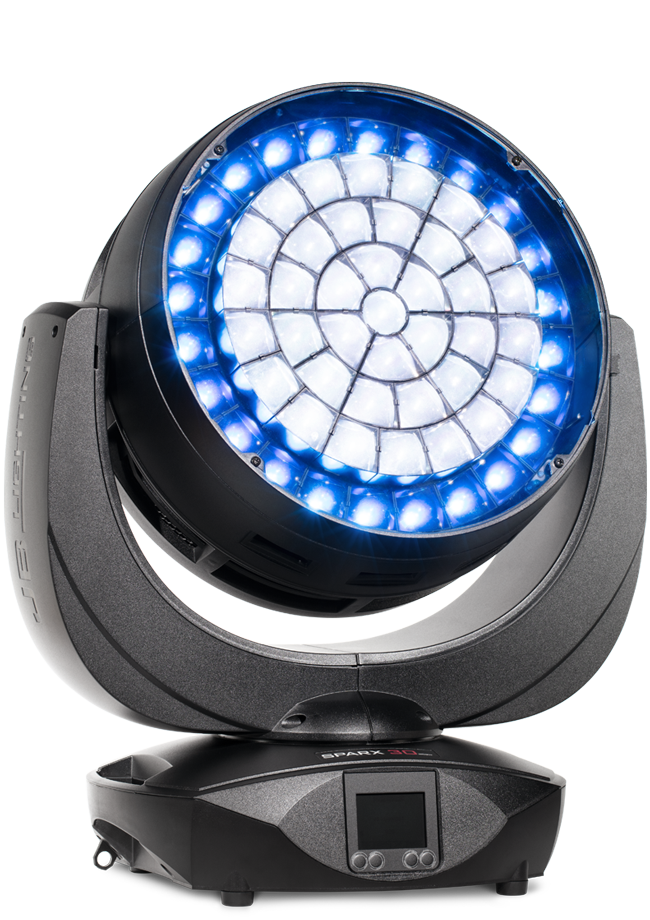
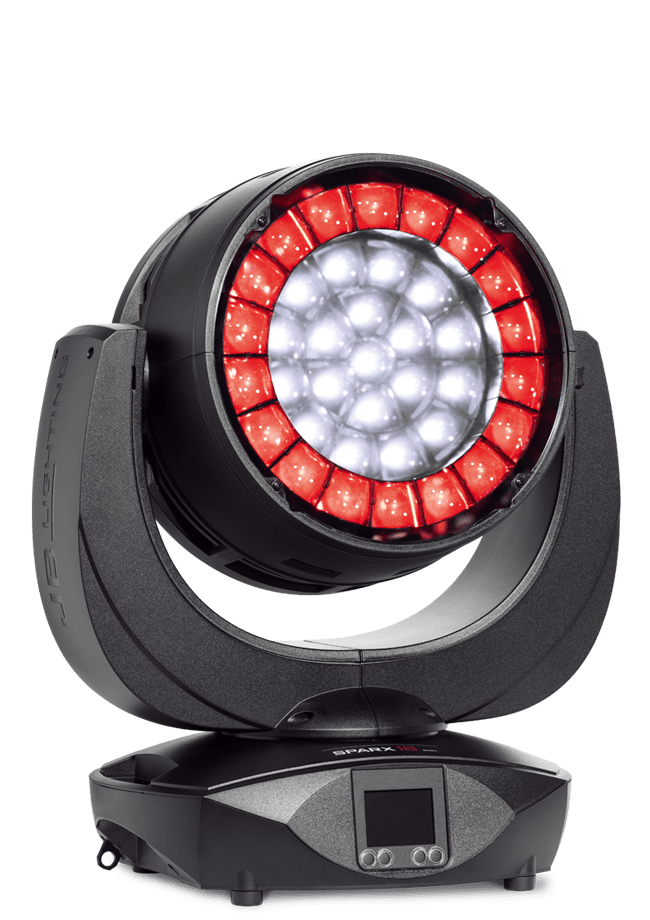
JB-LIGHTING SORTIMENT
In jeder Hinsicht beeindruckend!
Hochleistungs-Movinglights von JB-Lighting – dem einzigen Hersteller für intelligente Lichtsysteme, der seine Qualitätsprodukte ausschließlich in Deutschland entwickelt und produziert. Dein Star-Ensemble für professionelle Lichtinszenierungen und Bühnenbeleuchtung – made in Germany.


JB-LIGHTING SERVICE
Bester Service garantiert!
Wir legen bei der Entwicklung, Konstruktion und Fertigung unserer Hightech-Produkte größten Wert auf die Verwendung hochwertiger, robuster Komponenten sowie langlebiger und zudem wartungsarmer Technologien. Solltet Ihr trotzdem einmal für eines eurer JB-Geräte einen technischen Support benötigen, seid ihr bei JB an der richtigen Adresse.
Bei JB-Lighting gehört ein umfassender Service zum Qualitätsverständnis – kurze Durchlaufzeiten, kompetente Beratung sowie ein schneller technischer Support und Ersatzteilversorgung zu einem hervorragenden Preis-Leistungs-Verhältnis.
Bei JB-Lighting gehört ein umfassender Service zum Qualitätsverständnis – kurze Durchlaufzeiten, kompetente Beratung sowie ein schneller technischer Support und Ersatzteilversorgung zu einem hervorragenden Preis-Leistungs-Verhältnis.
Der direkte Draht zum JB-Service

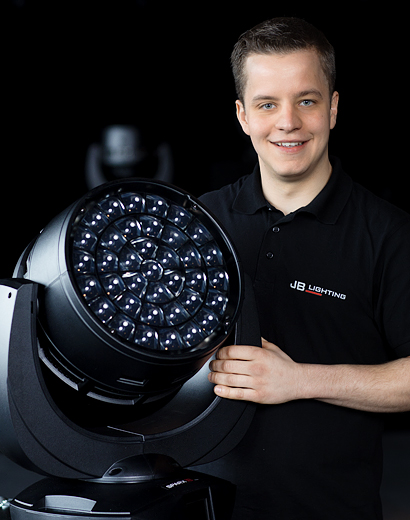


JB-LIGHTING TEAM
Gemeinsam erfolgreich!
Seit mehr als 30 Jahren entwickeln, konstruieren und produzieren wir in Wippingen intelligente Scheinwerfer und Lichttechnik-Lösungen. Mit einem Team aus absoluten Spezialisten und Fachkräften, deren Arbeit mehrfach ausgezeichnet wurde, darüber hinaus mit ihren Innovationen regelmäßig Ausrufezeichen setzen und deren Handeln seit jeher insbesondere von unserem Nachhaltigkeitsgedanken bestimmt wird.


